Commodity Matrix - Demo
MVP · Turmeric · Last updated —
Why this matters
Fragmented signals → actionable decisions
- Prices shift by location, grade, and value‑chain level (farm → mandi → wholesale → retail).
- We standardize units/grades and surface spreads, basis, and anomalies—the levers traders act on.
- Start with Turmeric (Nizamabad anchor), then scale to crops, companies, and global benchmarks.
- Transparent methodology, timestamps, and alert‑ready workflows build trust.
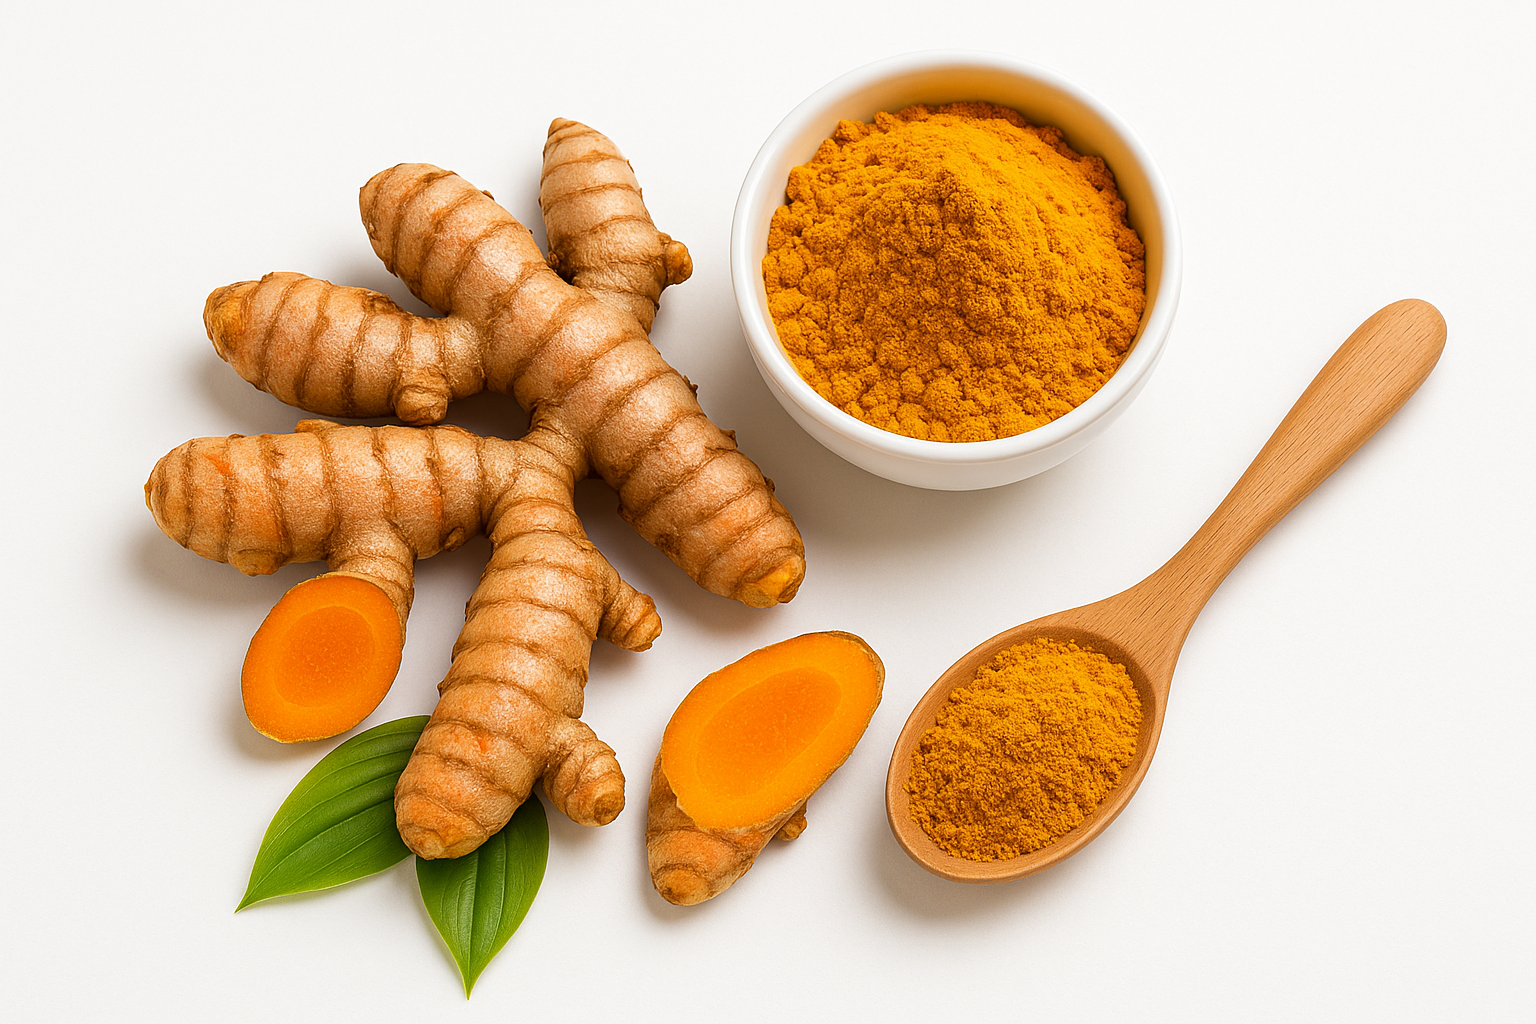
Turmeric (Photo)
/images/turmeric.png

Landed‑Cost & Spread
Delivered margin simulator
Basis Heatmap
Spot − Futures (near)
Nowcast Barometer
Tightness score
Anomaly Radar
Freight‑adjusted gaps
Caselet — Telangana mill (pilot)
Real ROI from alerts & arbitrage
- Improved buy by ₹180/qtl on 520 qtls in Aug.
- Caught 3 basis anomalies (>₹400/qtl) with alerts.
- Saved ~₹93,600 vs baseline; Pro Team @ ₹9,999 → 9× ROI.
National price
Median across reporting markets
Top 5 risers
d/d change
Top 5 fallers
d/d change
Value‑chain ladder
Farm
Today
Mandi
Today
Wholesale
Today
Retail
Today
India map
Heatmap by price / change
Placeholder — plug your choropleth (district/market) here.
Trend (90 days)
Median price with band
Seasonality
Average monthly pattern
Arrivals volume
WoW delta
Lower arrivals typically tighten prices.
Rainfall anomaly
% vs normal (IMD)
Negative = deficit rainfall.
Sowing progress
% of normal/target
Behind schedule can tighten future supply.
Prediction & backtest
Transparent forecasts with bands
Workflow & alerts
From signal to action
Sends when spot − near futures exceeds threshold.
Helps monitor procurement margins.
Methodology & data lineage
How we standardize, de‑noise, and stitch sources
- Units normalized to ₹/qtl (MVP); outliers clipped at 1st/99th percentiles; gaps filled with neighbor medians.
- Grade normalization via variety tables (to be wired); ladder derived to show farm→mandi→wholesale→retail spreads.
- Per-tile timestamp + coverage counters for auditability and trust.
- Sources (to wire): Agmarknet (mandi), DoCA PMD (retail/wholesale), IMD (rainfall), NCDEX (futures).
Markets reporting today
Coverage
Avg latency
Ingestion + processing
Last ingestion
Pipeline health
Roadmap & GTM
Next crops · global overlays · company pages
- Next crops: Chana, Wheat, Soybean, Sugar. Global overlays (CBOT/ICE, Pink Sheet).
- Company pages: commodity exposure → sensitivity; hedge planner; API for ERPs.
- Distribution: API, widgets, APMC/FPO/exporter pilots; WhatsApp/Telegram alerts.